 |
 |
|
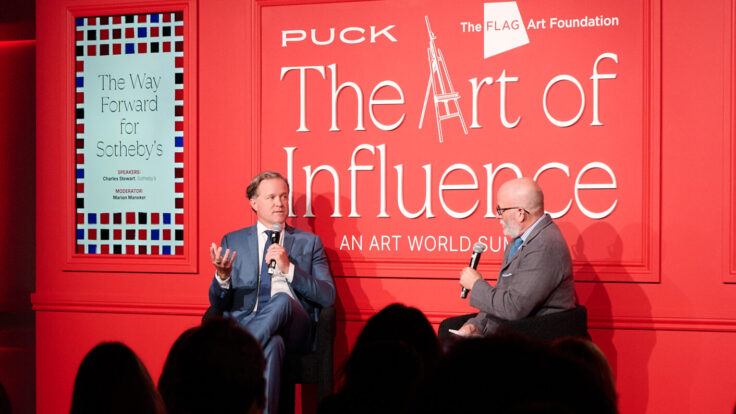
Welcome back to Wall Power. I’m Marion Maneker, and tonight I’ll be parsing some relevant market data from our friends at ARTDAI—including some indicators that suggest how we might tell when a bear market has turned. The good news is that we’ve already crossed some of those thresholds this year. More on all that below.
|
|
A MESSAGE FROM OUR SPONSOR
|

|
|
The art of the drive. The all-electric BMW i7 merges modern technology and timeless design to create a masterpiece. Learn more at BMWUSA.com.
|
|
|
But first…
- Please check your spam folders: Many of you didn’t receive Sunday night’s newsletter on Patrick Drahi’s $1 billion fundraise. I checked with Puck’s crack tech team and they, too, noticed an issue. So please check your spam folder if you didn’t get my take on what’s going on at Sotheby’s. Or read it here. I think it’s worth your time.
- Things are beginning to pick up in the art market: If you’ve got something you want to get off your chest in private , you can reach me on Signal at (917) 825-1391. If you just have a plain old complaint, think I’m wrong, or want to add something to what I’ve written (I’m looking at you guys at Sotheby’s), feel free to reply to this email or send me a text at the same number or on the Wall Power SMS.
- Artnet changes its financial reporting: In a letter to shareholders, Artnet explained that it was downgrading its listing on the German Stock Exchange from prime standard to general standard so as to save money by “eliminating the additional regulatory obligations. … These cost savings are mainly achieved by eliminating the unaudited quarterly reports (particularly their preparation, translation, and publication). The translation of financial reports into English and participation in at least one analyst conference per year will also be discontinued. Artnet AG will continue to publish semi-annual and annual reports (in German) and hold annual general meetings.” Artnet is due to hold its annual general meeting this month, but the firm has not yet released its annual report for 2023, which was slated to be published in May.
|
| Now let’s get to the market data… |
 |
| Finally, a Sign the Art Market Is Back… |
| A rigorous analysis of ARTDAI’s dataset shows that the concurrence of rising sell-through rates and an increase in the percentage of lots sold above estimates portends a strong season ahead—if these trends hold. |
|
|
|
| The art market is notoriously based upon sentiment. Sellers must believe there’s demand in order to put their art up for auction. Absent that proof, supply is constrained, and the auction totals fall. Conversely, if buyers think prices are too high, they hold back and sales totals can fall. And yet, the press routinely measures the market’s health by auction volume, which hardly captures the nuanced dynamics at play. So along with analytics firm ARTDAI, I worked to identify more relevant market indicators. In fact, I wanted to find metrics that would show the market’s true internal dynamics.
Alas, charts that demonstrated the percentage of works sold below, within, and above estimates were too complicated to get the point across. Instead, we wanted to look at average prices and sell-through rates. It stands to reason, after all, that sell-through rates matter: The auction houses put so much emphasis on them by getting (and giving) guarantees and, sometimes, withdrawing lots. Average prices also help us see if rising volume comes from a growth in top lots or more lots selling for lower prices. The art market can be very top-heavy, and results often look better than they are because a few really, really expensive works have sold. |
|
A MESSAGE FROM OUR SPONSOR
|
|
|
The art of the drive. The all-electric BMW i7 merges modern technology and timeless design to create a masterpiece. Learn more at BMWUSA.com.
|
|
|
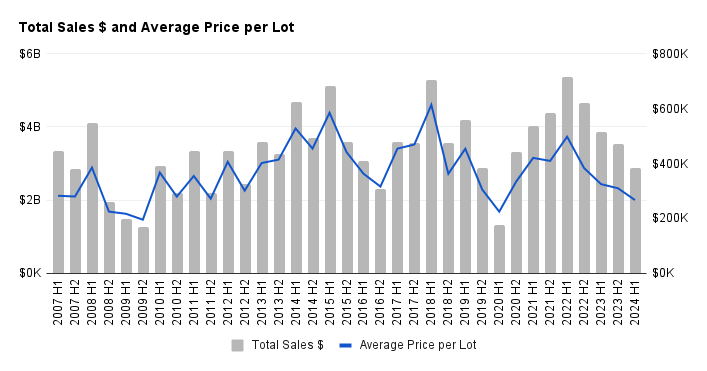
| To that end, ARTDAI was able to chart the average price of auction lots compared with total auction volume. For the most part, average prices rise and fall with sales volume, but that’s often because there are more high-value works being sold when dollar volume rises. Again, this all gets back to sentiment: More sellers will test the market when the market, in their eyes, seems worth testing. |
|
|
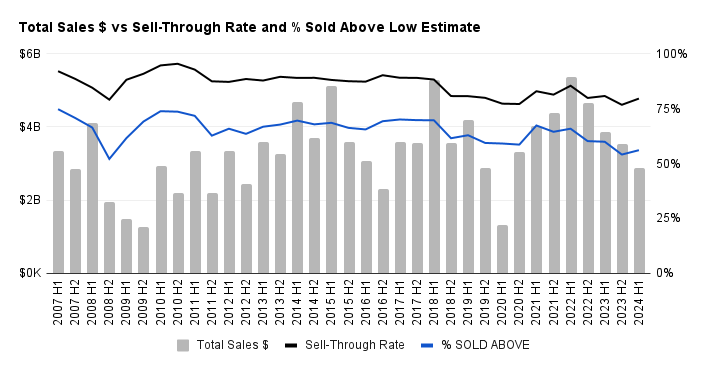
| Most seasons, average prices correlate to sales volume. To plumb this data in more detail, ARTDAI was able to chart the sell-through rate for each semester of the year and the percentage of lots that sold above the estimate for each season. Interestingly, we found that the convergence of a rising sell-through rate with an increasing percentage of lots sold above estimate portended strong sales seasons. In 2009 and into 2010, for instance, there was a sharp rise in sell-through rate and percentage sold above the low estimate. Consequently, sales volumes and average prices recovered dramatically in the first half of 2010. Likewise, a sharp increase in both metrics in the second half of 2016 was followed by a jump in total sales volume and average prices through all of 2017. Again, in 1H2021, both metrics rose steeply as the market made leaps into the upper ranges of total sales volume. |
|
|
| For many, this year’s first-half auction total of around $2.87 billion seemed like a total drag. But despite the dreary narrative, 1H24 saw a pronounced rise in both the percentage sold above low estimate and the sell-through rate. Does this presage a stronger season in the fall?
Maybe. Volume will depend more upon the consignments than any other factor, but these numbers are encouraging. Remember, when the auction houses pitch clients on whether to consign, they’re using some of this same data to make their case. It’s not foolproof: There was a rise in 1H22 that was followed by falling auction totals. And, of course, this is a small sample size. Nevertheless, we’re beginning to see encouraging patterns. |
|
|
| Why am I telling you all of this? Well, firstly, to establish that the market has ups and downs as well as patterns. Looking at the data, the period from 2010 to 2015 seems fairly distinct, while 2016 to 2019 had a very different market pattern. And from 2020 until today, we saw yet another.
Some of that could be explained by external factors. The years between 2016 and 2019 were marked by the rise of political populism around the world, which fed into a mood of economic uncertainty. The pandemic and all of the efforts to mitigate its disruption, obviously, also had a big effect on the market in recent years. But even as every market era has its own story, there are still similarities and patterns worth delving into. Take, for example, the first go-go art market of the 21st century that formed into a blow-off top as auction sales reached $4.1 billion in just the first half of 2008, driven by oil prices that skyrocketed from $136 per barrel to over $200 in six months. It won’t surprise you that the big buyers of that era were from energy-producing regions such as the Gulf States and Russia. |
|
|
| Art auction sales came to a screeching halt in the second half of 2008—even with Damien Hirst’s $200 million Beautiful Inside My Head Forever sale at Sotheby’s—as the panic of the incipient global financial crisis gripped buyers. The total for all three auction houses in the second half of 2008 was $1.9 billion, less than half of the previous semester’s sales. In the first half of 2009, despite the record total for the Yves-Saint Laurent-Pierre Bergé sale that went for around $525 million at Christie’s, the auction market fell another 25 percent as banks tumbled. In the second half of 2009, the market pulled back another 14 percent, to reach a generational low of $1.3 billion in auction sales.
From there, the market crept up in its unique rhythm of strong first half and not-as-strong second half. From the first half of 2010 to the first half of 2015, sales rose steadily. The total was $2.9 billion in the first half of 2010; by the first half of 2015, sales had reached $5.1 billion. That’s a 78 percent increase. Those were the salad days of the art market, as gratifying as they were unexpected after the depressing pall of 2009.
But those five years of steadily rising sales totals became the template for many participants’ expectations about the art market—which is a challenge in a sentiment-based market. Instead, the period of 2010 to 2015 was clearly a structural shift in the way we thought about the value of art. It’s also the period when new collectors “discovered” the art market, with its international circuit of art fairs and global sense of class formation and participation. The art market was becoming a place where rich people around the world aspired toward a shared culture.
Although the global population of ultra-high-net-worth individuals has roughly doubled since 2015, the art market has struggled with ups and downs since 2016. (That’s when the longstanding pattern of increasing first-half totals seems to have broken.) The market contracted in 2016, recovering somewhat in 2017, though the two semesters’ sales totals were almost equal (without M.B.S.’s $450 million purchase of Leonardo’s Salvator Mundi in November, the familiar pattern would have stood up.) The following year, the Rockefeller sale finally pushed the auction market above the previous top of 2015 (by around $160 million). In 2018 and 2019, it began to look like the old pattern of a stronger first half of the year was going to re-establish itself.
Then came the pandemic, when the growth of an absentee online audience for sales meant the old calendar might be up for serious reconsideration, and the flood of global liquidity sent art collectors on a frenzied buying spree. We saw auction sales rise steadily from $3.3 billion in the first half of 2020 to $5.4 billion in the first half of 2022. That’s an impressive 62 percent rise, especially notable considering the 2020 numbers had been around the 2017 level.
I’ve pointed out previously that we saw pretty much the same pattern after 2018’s peak that we’ve seen over the last two years. History in the art market doesn’t even rhyme; it often repeats.
The historical data we have from ARTDAI helps us see that the art market is never really as good (or bad) as it seems. Each of the last three successive cycles have topped out slightly higher than the previous one. At $2.87 billion for the first half of 2024, we’re already below (on an inflation-adjusted basis) the previous market low. If the historical pattern holds, we could be looking at a season close to $5.5 billion in just a couple of years. |
|
|
| Next time, I’m going to delve into the price bands. ARTDAI divided the lots into works sold above $25 million, those sold between $5 million and $25 million, between $1 million and $5 million, $250,000 and $1 million, and so on. Trust me, geeking out like this unlocks stuff even the savviest collectors don’t know about the art market.
See you on Sunday,
Marion |
|
|
|
| FOUR STORIES WE’RE TALKING ABOUT |
|
|
|
|
|
 |
|
|
|
Need help? Review our FAQs
page or contact
us for assistance. For brand partnerships, email ads@puck.news.
|
|
You received this email because you signed up to receive emails from Puck, or as part of your Puck account associated with . To stop receiving this newsletter and/or manage all your email preferences, click here.
|
|
Puck is published by Heat Media LLC. 227 W 17th St New York, NY 10011.
|
|
|
|